by Claudia & Conrad.
Background
Deriving from our conversations within the Farmer-Ecologist Research Circle during the winter and early spring of 2025, this season we are exploring a set of questions related to on-farm flowers and beneficial insects. Specifically, wild flower plantings are being promoted for a variety of reasons, including their support of insects. At the same time, the value of fallow and edge wild flowers is sometimes underappreciated. The Circle thus became interested in understanding what resources planted flowers might provide to insects relative to what wild-growing flowers are providing – are such plantings worth the extra effort? How might the seeded and the unseeded flowers best complement each other?
Specifically, our questions are the following:
- Which flowers (cultivated and wild-growing, native and non-native, intentionally managed or growing spontaneously) occur on farms? Where on the farm do they occur and when in the season?
- Which of the above flowers are most attractive to easily observable insect groups (such as Bumble Bees, Other Native Bees, Honey Bees, and Hoverflies)? Does one size fit all flower-wise, or is a diversity of floral shapes, sizes and colors important?
- Based on the answer to the above two questions, which areas of each of the participating farms might be providng the most flower resources to each insect groups and how does that differ across the growing season?
There are various ways that one might approach answering these questions. The ‘Cadillac’ version (did we just date ourselves?) might be to do intensive surveys of flower diversity and abundance based on sampling plots and multiple counts coupled with some sort of standardized insect surveys such as with bee-bowl traps and netting. While potentially more rigorous, this would be a full-time job, plus it might not actually give much information on the value of individual types of flowers. So, instead, we decided to do something that is a bit more “quick-and-dirty,” but which, we hope, nonetheless allows us to get a good first glimpse of the answers to the above questions.
During our monthly visits (June through September), we try to spend 2-4 hours at each farm, documenting the flowers and their insect visitors in a section of the farm that includes a variety of habitats and management units. While doing the entirety of each farm would be cool, it’s beyond our current person-power. During each visit, Claudia ranks the abundance of the flowers of each species in each management unit and also assesses the overall flower abundance in each of those. She identifies each plant in flower and assigns it a floral abundance rank (A through D, with D being most common). Conrad observes and counts the insect visitors to flowers by doing five-minute ‘wandering flower watches’ for each species. For simplicity, four insect groups are presented here: Bumble Bees, Other Wild Bees, Honey Bees, and Hover Flies. During each of these strolls, new flowers of the given species are constantly being found and the observed presence of any insects is tallied. (The small print: To help correct for the effects of a particular farm or day, these flower visitation rates are standardized by the overall mean of the visitation rate for each of the four insect groups across all flowers on the given farm and then the standardized values for the focal flower are averaged across all farms at which that flower was observed.)

As the above map shows, the participating farms are Blue Star Farm, Hawthorne Valley Farm, Ironwood Farm, Little Seed Gardens, Whistledown Farm (all in Columbia County), Rose Hill Farm (in Dutchess County), Hudson Valley Seed Company, Stars of the Meadow Farm, and Treadlight Farm (all in Ulster County).
By jointly examining the results, we hope to help farmers see which areas of their farms might already be doing “good work” in support of certain flower-visiting insects, where there might be spatial or seasonal gaps in resources for these insect groups on a particular farm, and what might be practical ways to improve the floral offering. That said, it’s important to realize that there are factors other than just immediate flower availability which can affect bee (and other insect) abundance. These include access to suitable nesting conditions (such as good burrowing soils for ground nesters or the presence of hives for Honey Bees), conducive land use in the general surroundings (for example, freedom from pesticides or intensive car traffic), a flowering calendar that provides nectar and pollen throughout the insects’ life cycles, and, potentially, freedom from competition (under some conditions, Honey Bees are thought to compete with certain other bees species).

This blog shares our observations from the first round of visits (June 5 to July 3, 2025) and illustrates our approach. The delineation of the habitats and management units is tentative and we expect to make some refinement in the next round of site visits.
Please let us know which results are most interesting to you. Is there anything else you would like us to document while we are out there? Do you have any questions?
What We’ve Found So Far: Flowers on the Farms in June
We found more than 200 species of flowers on eight of the farms (unfortunately, Claudia was unable to get to Stars of the Meadow Farm in June; Conrad did tally insects on flowers but the vegetation wasn’t mapped in detail). The most diverse group of flowers on the farms, with 83 species, were the non-native, cultivated plants. These included cover crops (such as Buckwheat or clovers, vetch and pea species), cut flowers (such as Zinnias, Snapdragons, and Marigolds), vegetables that need to bloom in order to produce the crop we eat (such as Tomatoes, Peppers, Squash and Cucumbers), as well as culinary herbs and leafy greens allowed to set flowers (such as Dill, Cilantro, Arugala, and other brassicas). Almost equally diverse, with 80 species, were the non-native wild-growing plants (“weeds”), which included ten species considered invasive in our region (such as Canada Thistle, two species of knapweeds, and Ground Ivy). Flowers were also found of 32 native wild-growing species (for example, Annual Fleabane, Common Yellow Wood Sorrel, and Common Milkweed) and on 18 native species cultivated for cut flowers (such as Fringed Loosestrife, Foxglove Beardtongue and several species of mountain-mints).
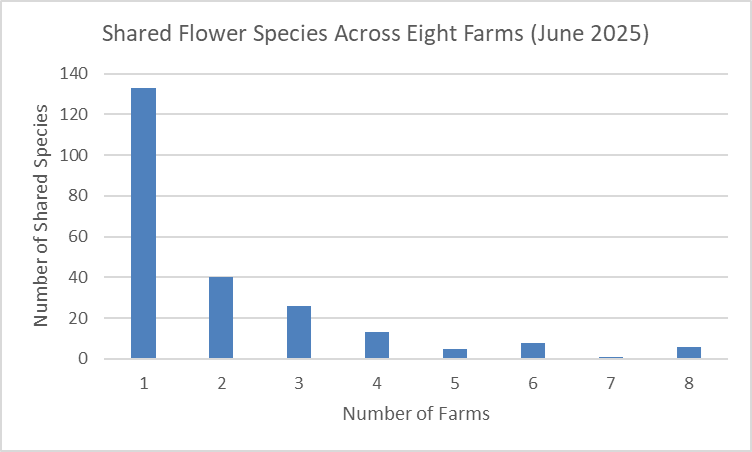
A small group of flowers were found at all nine farms. These ubiquitous flowers were Annual Fleabane, Narrow-leaved Plantain, Red Clover, White Clover, Wild Madder (aka Common Bedstraw), and Common Wood Sorrel.
The following graph illustrates just how different the eight farms visited by Claudia were in terms of their flowers. Only the six species just mentioned were found on all eight farms she visited in June (and in fact, they were all also observed at Stars of the Meadow in July) . A few additional species were shared by more than four farms, while 133 flower species were found at only a single farm.
What We’ve Found So Far: Flower Abundance within Management Units and across Habitat Categories in June
The following map shows a color-coding of the study units at each farm by rank in flower abundance, increasing from zero (no flowers), to A (rare flowers), B (medium density of flowers), C (flowers common), to D (flowers abundant). (Again, Stars of the Meadow is missing from these maps this time around, but will be added in July and subsequent months.)

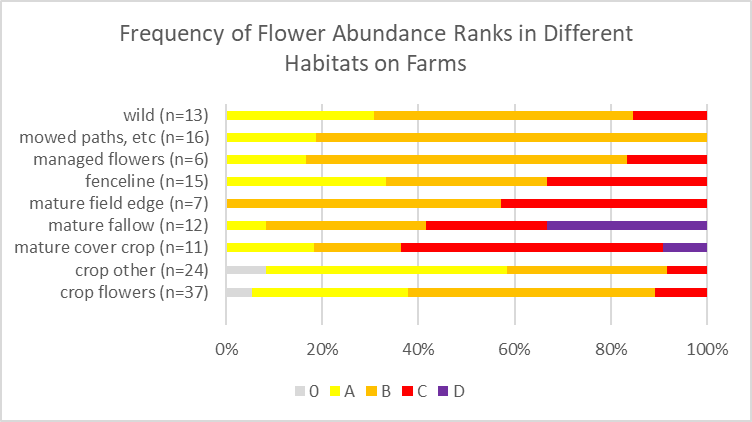
We only assigned the highest flower abundance rank D to five fields/management units in June: four of them were mature fallow fields (tilled within the last year or two, but not yet managed in 2025), of which three were dominated by the flowers of Daisy Fleabane and one by Wild Madder (Common Bedstraw). The fifth was a Buckwheat cover crop in full bloom.
When comparing the flower abundance ranks assigned to the most common habitats we surveyed, we see that, in addition to mature fallow fields and mature cover crops, some of which reached very high flower densities, the habitat with the most consistently high density of flowers was mature field edge. Wild habitats, managed flowers, and fencelines sometimes also had a lot of flowers, but sometimes not very many. Early in the season, beds with crop flowers were quite variable in their flower abundance and still had overall relatively few flowers.

What We’ve Found So Far: Flower Diversity within the Management Units and across Habitat Categories in June
The following map shows a color-coding of the study units at each of the eight farms by number of species in flower (which did not always correlate with the abundance of flowers).

We found the most diverse (species-rich) flower communities in mature field edges and mature fallow fields. Most wild areas also had diverse flower communities, but some did not (at least not in June).
What We’ve Found So Far: Which Insects Like Which Flowers?
Before summarizing the insect results, let us tell you some of the reasons these data should be taken with a grain of salt:
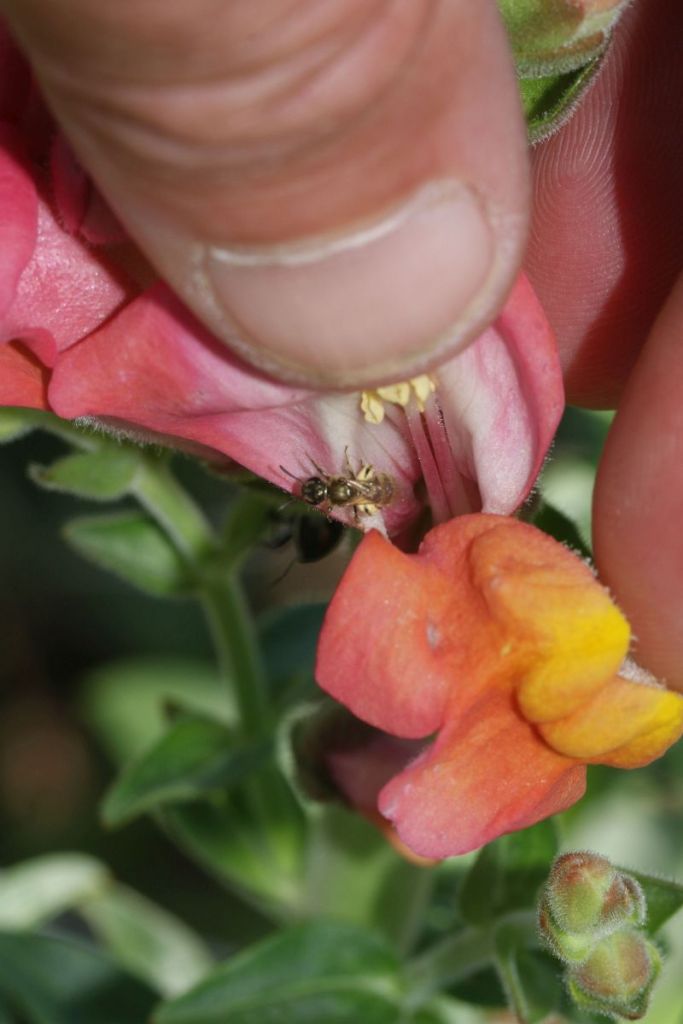
Our approach is based on seeing insects on flowers. This means both that smaller, less conspicuous insects surely tend to go unseen and that insects entering closed flowers like snapdragons or dangling flowers, like those of Potatoes or Horse Nettle, are unreported because they were hidden from view. Furthermore, while the stopwatch of our visual surveys only ran while our eyes were inspecting flowers, there is no doubt that more flowers (and hence potentially more insects) were observed when those flowers were growing in tight clusters than when they were growing as singlets or small clumps. Finally, the ‘ripeness’ of flowers (that is, how much nectar and pollen they are offering) is not always immediately apparent. If you spend time watching flowers, you’ll notice that, even within a single flower species, the attractiveness seems to vary across dates and even within days. For the more common flowers, we have data from multiple dates and several different farms and our averaging might iron out some of the flukes; however, some flowers were only observed for one 5-minute block on one farm and what we saw then is what you get. All this adds ‘noise’ that might confound actual patterns…
But, with these caveats in mind, what did we find?
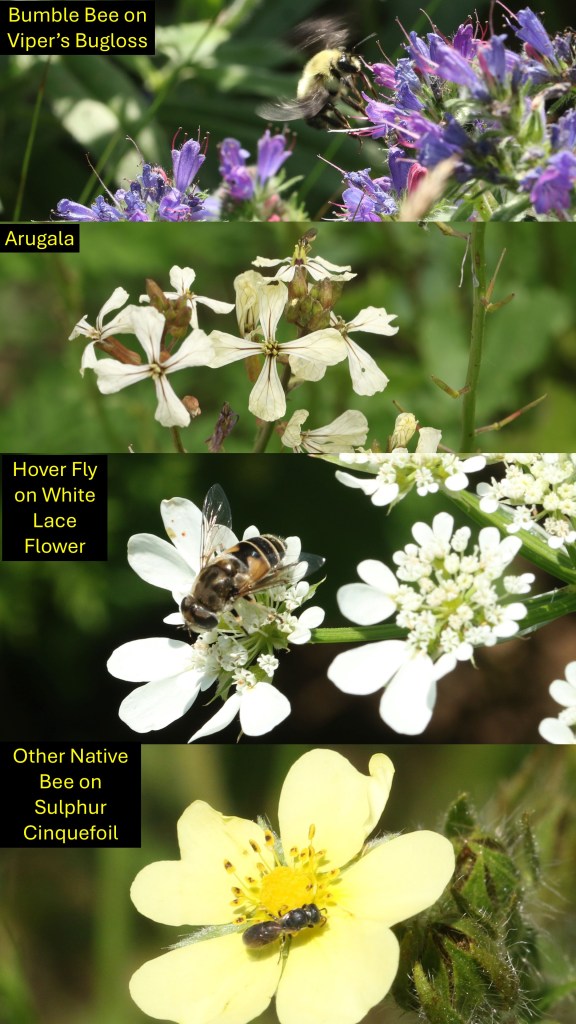
In this table, the number indicates the value of the given flower relative to the average of all flowers observed in June. For example, Viper’s Bugloss was more than 15 times as popular for Bumble Bees as the average flower. Only flowers 1.5 times or more above average are listed. Colors just highlight the same flower on different lists. You can expect these numbers to change somewhat as the season progresses and we collect more observations.

The above table shows the top flowers for each group of insect visitors. A few general comments are worth making: the same flower can differ markedly in apparent attractiveness for the different groups of flower visitors. For example, while Pasture Rose ranked second for Bumble Bees, Arugala ranked first for Honey Bees, White Lace Flower was tops for Hover Flies, and Oxeye Daisy was in second place for ‘other bees’, none of these flowers even appeared on the lists of the other insect groups. At the same time, some flowers, like Viper’s Bugloss, Chicory, and Echinacea appeared on three or even all of the lists. While the reason for the preference differences amongst the insect groups is not always clear, certain patterns might be discernible. For example, if one compares the flowers favored by Bumble Bees and Hover Flies, one notes that, relatively speaking, the Hover Flies seemed to favor shallower, smaller flowers. Perhaps we’ll be able to tease apart more of such patterns as we collect more data.
Native vs. non-native and intentionally seeded vs. spontaneous don’t seem to be great predictors of most favored flower status. For instance, Viper’s Bugloss and Chicory are non-native ‘weeds’, Arugala and Asian Greens are non-native crops, Common Milkweed and Annual Fleabane are native ‘weeds’, Bachelor Button is a non-native ornamental seeded flower, and Echinacea is a native (or ‘near native’) ornamental seeded flower. All of these flowers figured at or near the top of some insect lists. Of course, our gross categories of flower visitors may hide more specialized relationships as was evidenced by our sighting of Macropis bees, a native bee specializing on planted but native Lysmachia (aka our native Loosestrifes). These bees collect the oils that such flowers produce.

What We’ve Found So Far: Mapping Flower Suitability.
Finally, we present a series of maps showing the predicted pollinator value of each management unit on each farm. Please note these are NOT maps of where we necessarily saw the most bees, instead they’re predictive maps showing our guesses as to which patches were most attractive to the different groups based on flower composition and our flower visitor data. A logical extension of our work would be to test our models by going into each management unit and gathering an activity index for each of our flower visitor groups. Because of their crudity and the non-floral factors that can affect bee abundance (listed above in the Background section), these June maps are very much only part of a larger picture and may or may not reflect the insect abundance you observe.
In these maps a darker tone means more of the given insect group. For a given farm, each frame is a different insect group.

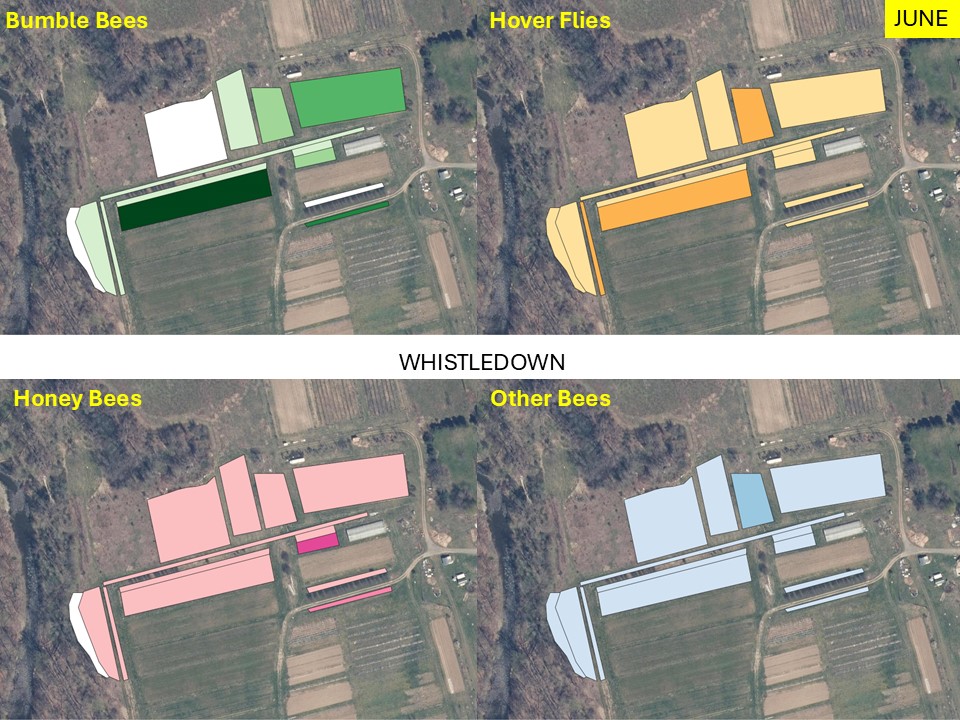
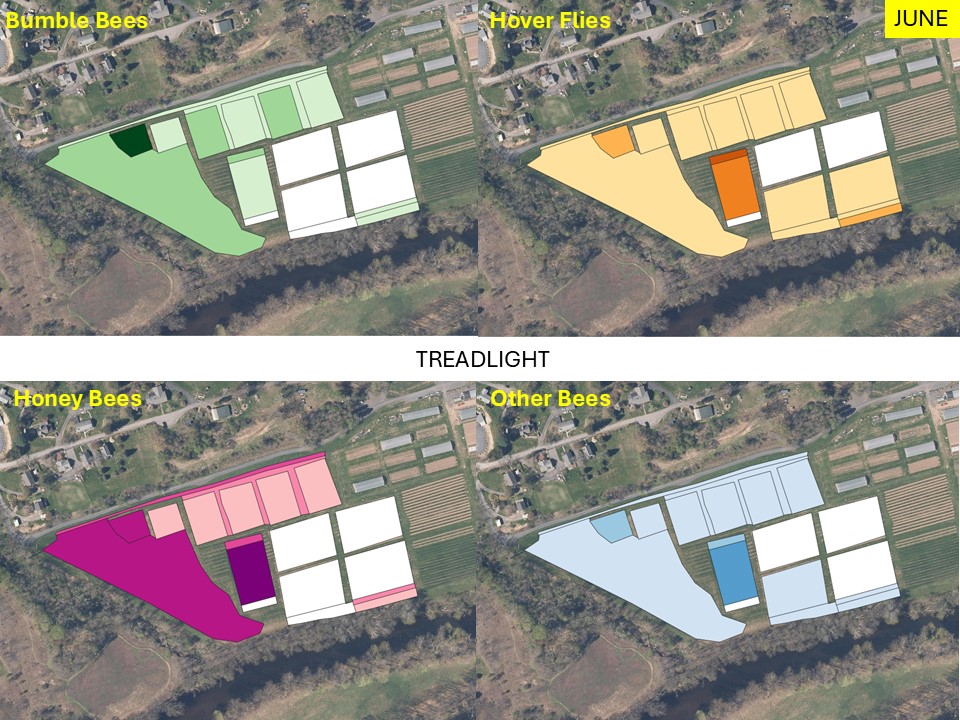
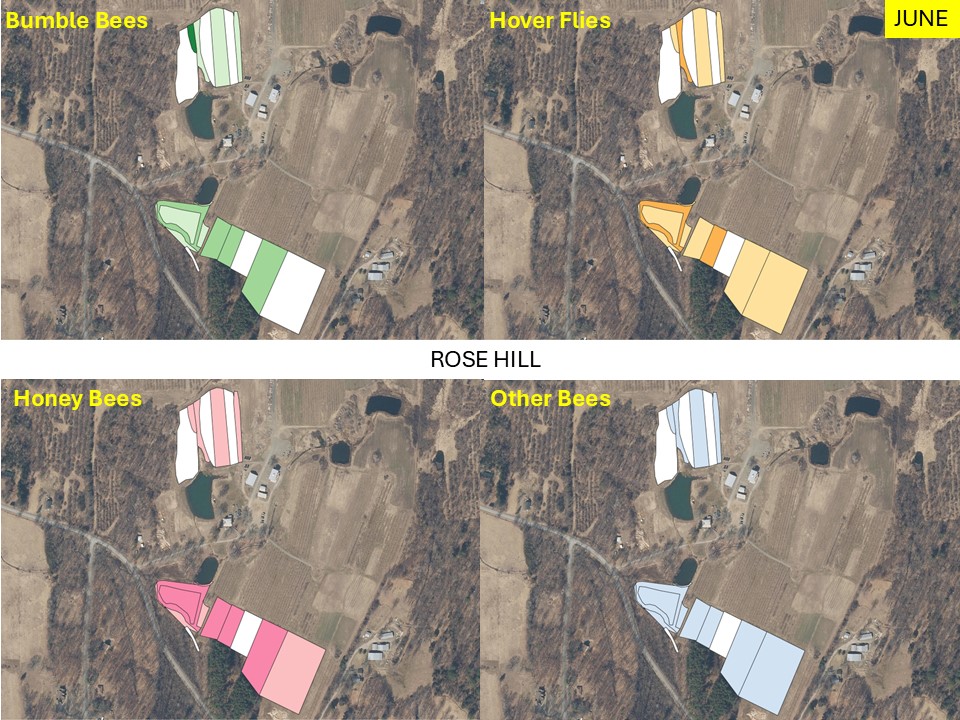
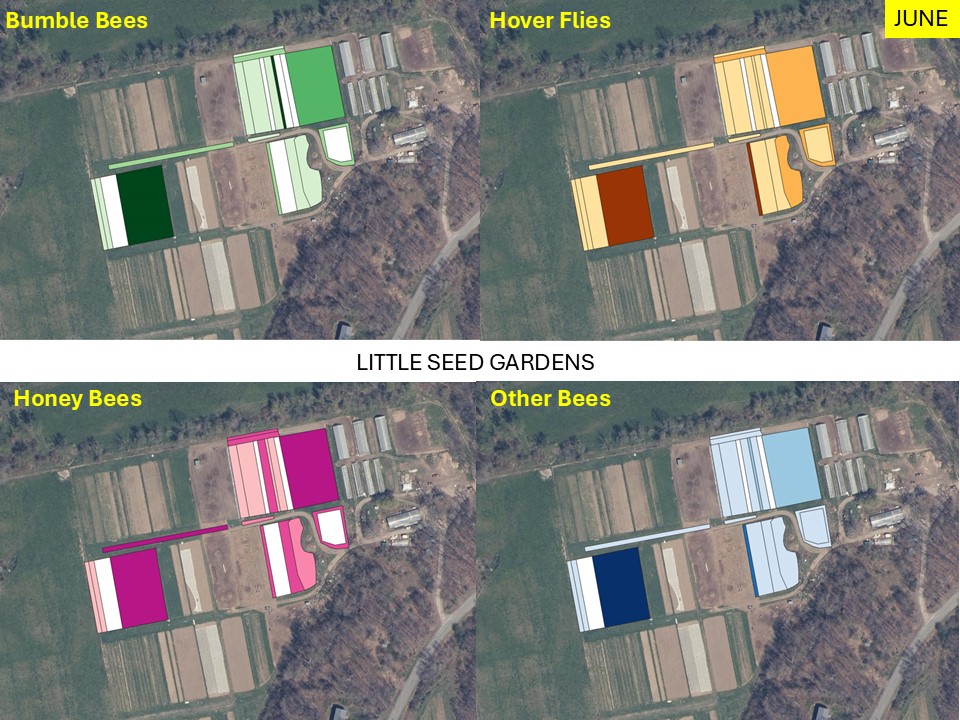
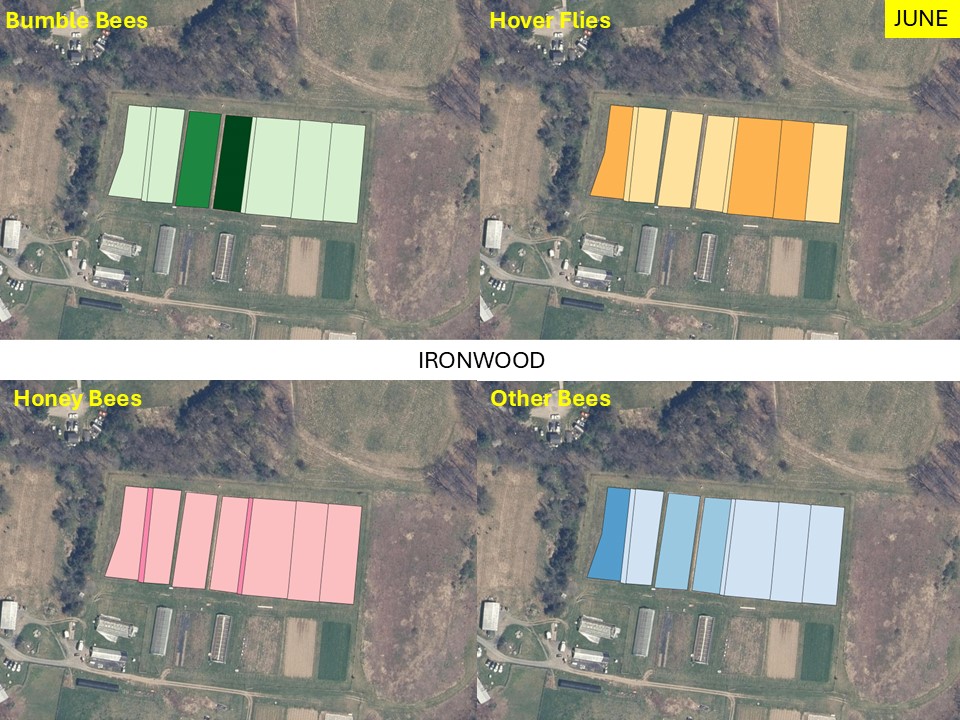
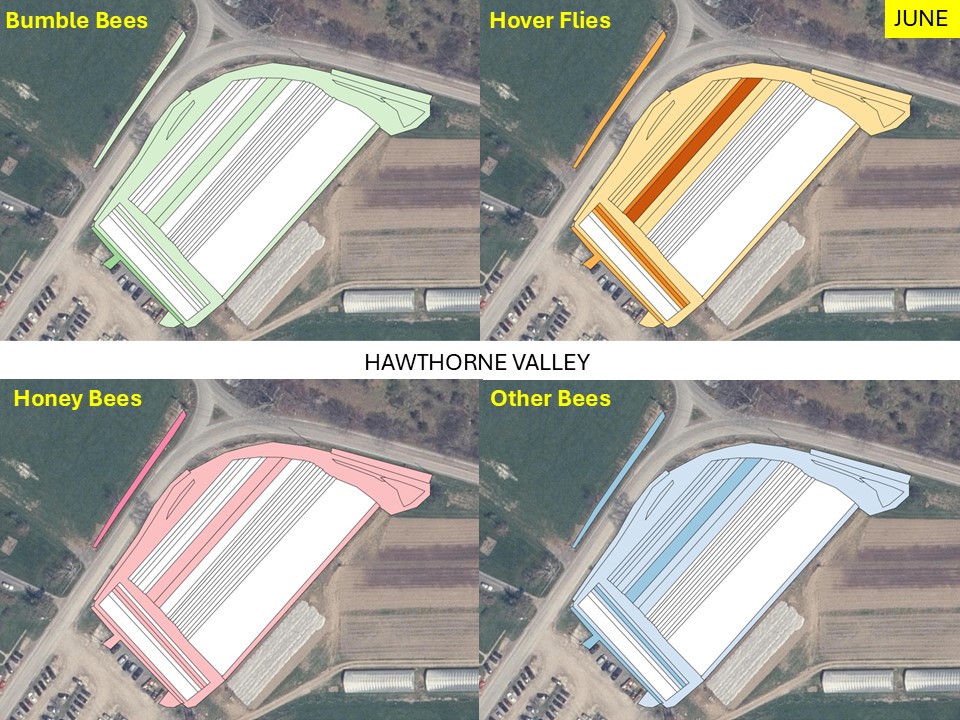
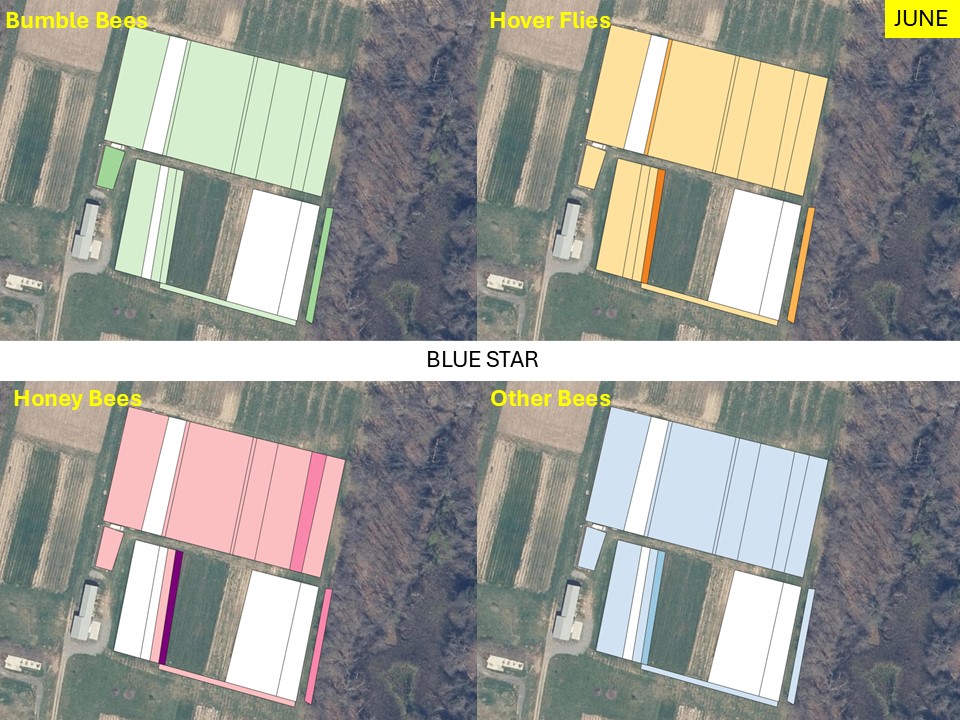
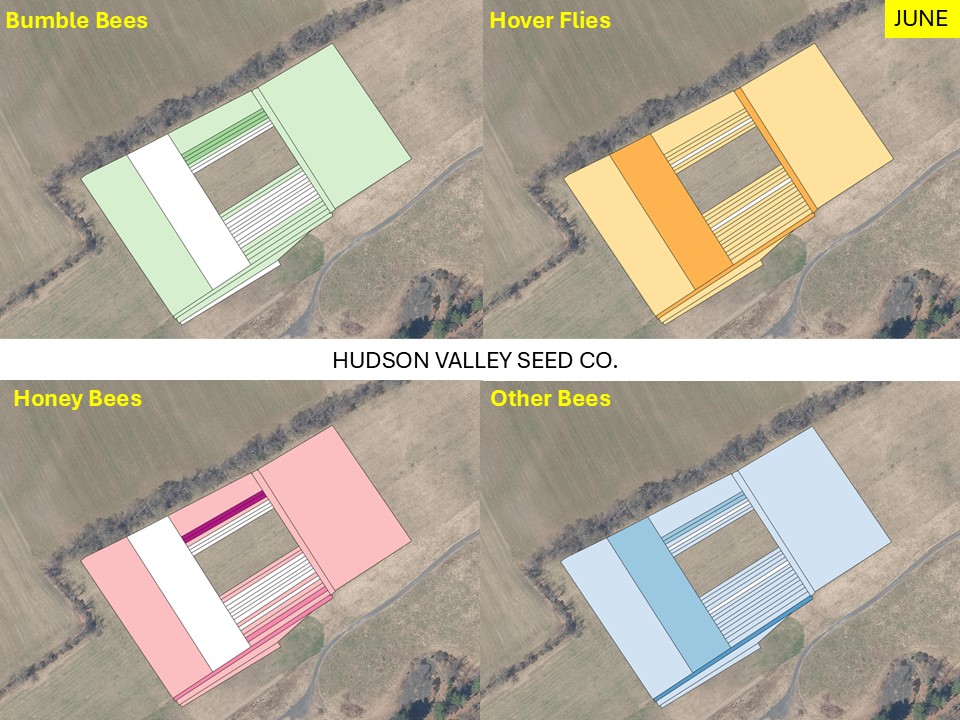
We realize that, unless you are familiar with the individual farm, these maps are somewhat hard to interpret. We will try to provide more individual farm details in our next blog but, in the meantime, some general patterns seem evident:
Predicted suitability can be quite patchy – attractive beds or patches abut less attractive ones. There’s nothing surprising about that given the obvious variation in flower composition across beds. Perhaps somewhat more interesting is the fact that the patterns vary depending upon the focal insect group. This derives directly from the previously described variation in insect suitability amongst flowers and the patterns of flower composition across units.
Both farm beds and edges, as well as fallows and semi-natural areas can be valuable. Flower visitors are constantly trying to make the best choices from the flower smorgasbord available to them, and these maps suggest that those offerings will lead them into suitable patches regardless of where on a farm their favored flowers are found – for example, contrast where one is likely to find flowering Arugala with where one finds Milkweed (two of the Honey Bee’s favorites).
It’s important to highlight what these maps DON’T show – were we to map suitability for particular bee species, these maps would sometimes be very different. For example, there are native bees who only feed at particular Spring ephemerals; maps of habitat suitability for these species would essentially be completely empty given that none of the beds on any of the farms supported those flowers. Likewise, a map of flower suitability for the Squash Bee would largely (but not entirely) be a map of squash beds. At the opposite end of the spectrum, some of the common members of each of the multispecies groups (Honey Bees are only one species) are single species with broad tastes – maps of their suitability might not differ too much from what is shown here. In between these extremes come the tastes of slightly more specialized bees. For example, in our current July round of visits, we found Mellisodes bimaculatus (a bee that looks somewhat like a black bumble bee with two white patches on its tail end) going to town on corn tassels at Ironewood while it was absent from most other flowers at that farm on that day. Likewise, Hyleaus, a genus of somewhat wasp-like bees, has so far seemed to show a marked preference for certain shallow flowers like Queen Anne’s Lace. In other words, our gross groups hide subtler patterns. We are trying to refine our insect categories, but will probably have to continue to rely on this somewhat anecdotal approach for the nuances.
Final Thunks.
Seeded flowers have value in addition to the support of insects – they have general aesthetic appeal, may be part of a commercial operation growing retail flowers, or may serve as an added pick-your-own perk for CSA members. Sometimes flowers are included as companion plantings meant to help control certain pests and, finally, certain crops are sometimes allowed to flower because it is necessary for food production (e.g., tomatoes and cucurbits) or the farmer wants to harvest their own seeds. (Of course, leaving leftovers to flower is also done as an easy way to augment local blossoms). Clearly, the results presented here are not the only way to judge the value of on-farm flowers, but we hope that if flowers for insects is one of your goals, then our observations might be useful.
Going forward, we are into our July round of visits and it is fun to see new species of flowers and bees interacting in new ways. It seems safe to say that the July round of maps will show different patterns from the June ones, but we’re also curious to see if there’s any consistency. In the meantime, if any of the above observations raise questions or provoke observations, we’d enjoy hearing them. And we always enjoy hearing of neat flowers or insects you spot!